Introduction > Data Integration
Data Integration
VirtualPlant gets data from multiple sources. The tables below list some of the different data that are stored in the database. VirtualPlant updates annually, a few monthe after new annotation releases from TAIR (for Arabidospis) and Gramene (for Rice)
Arabidopsis
| Data | Source | Reference | Last Updated |
| Gene Annotation | TAIR | http://www.arabidopsis.org | |
| Functional Categories | Gene Ontology MIPSFuncat |
http://www.geneontology.org http://mips.gsf.de/projects/funcat |
|
| Biochemical Pathways | KEGG ARACYC |
http://www.genome.jp/kegg/ http://www.arabidopsis.org/biocyc/index.jsp |
|
| Regulatory Interactions | AGRIS | http://arabidopsis.med.ohio-state.edu/ | |
| Microarray Data | Publicly Available Experiments Probe to Gene Associations |
NASC's Affywatch Service Affymetrix |
|
| Protein Interactions | BIND Interologs (Based on Homology) |
http://bind.ca Gerstein Lab (YALE) |
|
| Literature Based Interactions | GENEWAYS | http://geneways.genomecenter.columbia.edu/ | |
| miRNA Interactions | ASRP | http://asrp.cgrb.oregonstate.edu/ |
Rice
| Data | Source | Reference | Last Updated |
| Gene Annotation | Gramene 29 | Biomart | |
| Functional Categories (Gene Ontology) | Gramene 29 | http://www.geneontology.org |
MultiNetwork
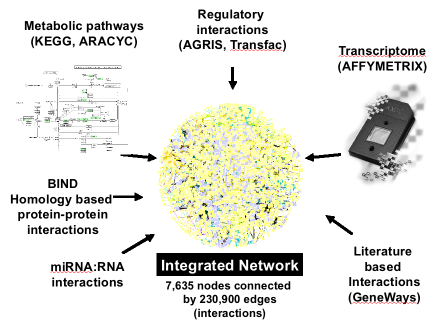
The multinetwork is a database of molecular interactions obtained from the sources listed above. Several VirtualPlant tools use the multinetwork for their analysis.:
- Network Statistics : Network Statistics queries the multinetwork and based on the edges selected in the Query Form it displays the nodes(genes) in a sorted table from most highly connected to least connected.
- Gene Networks : Gene Networks queryies the network prepares a file which installs and launches Cytoscape (www.cytoscape.org) where the user can visualize the molecular interactions based on the selections in the Query Form.
- Super Node Networks : The Super Nodes Networks method works very similar to Gene Networks, however it has an extra step of grouping the genes based on some functional categories, such as GO terms, MIPS, Gene Families, etc. The size of the nodes are sent as attribues to cytoscape so the suer can use it to modify the visualization property.
 > NEXT
^ TOP
PREV <
> NEXT
^ TOP
PREV <